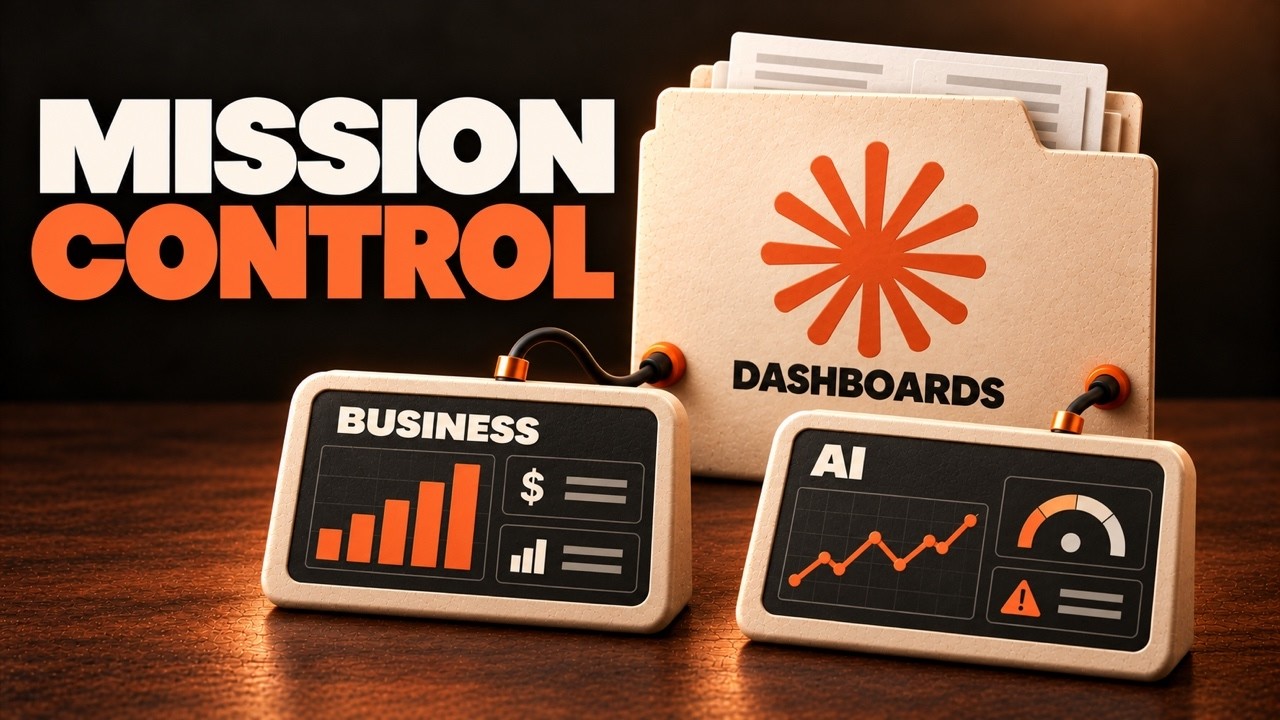
0:00Claude just shipped a new feature: Dashboards. You connect your data, ask a question in plain language, and Claude builds a live dashboard behind every query — writing the SQL and assembling the charts. 0:18Point it at your business and you get business intelligence — where your cash is, what's overdue, where you're burning money. Point it at the AI running your business and you get observability — what's running, what's failing, and what it's costing. The argument Mansel Scheffel makes up front: you need both.
What launched
0:30Claude Dashboards (alongside Claude Motion, an animated-explainer tool) entered public beta on October 8, 2026. In the same release, Anthropic took Docs, Slides, and Design out of beta and onto every plan, including Free. The mechanics are simple: there's a new Dashboard tab in your Claude account, and it leans on the existing connectors system to reach your data.
Artifacts vs dashboards
0:42The key distinction the video draws is why this isn't just "artifacts again." You could already build dashboards inside artifacts — but those were HTML artifacts, snapshots in time. You couldn't query them live from a database where all the information is actually captured. A Claude Dashboard, by contrast, pulls live from a connector or database every time it refreshes. Once the data is centralized, you get something that updates rather than a frozen picture.
Two use cases
1:00The first use case is observability into your own Claude/AI infrastructure. By taking metrics out of OpenTelemetry and pushing them into a database, you can report on things Claude doesn't surface natively — which skills actually run, how much you're spending, what's failing, what it costs. Scheffel had built this by hand before ("raw HTML and my own listener"); now it lives inside Claude. 1:48The second is the business-owner use case: pull data from every system you run (Stripe, Fathom, whatever customers talk to you through), put it in one place, and build a single source of truth for the whole business — to see what's winning, what's failing, and who hasn't paid on time. Scheffel's framing: it might look like a trivial update, but it's one of the best things an everyday business owner can have, because you can open a chat and just say "go build this for me."
Connectors → dashboard
2:47The flow is: add data sources in the connectors tab (anything from Gmail to an Excel sheet), then ask Claude what the dashboard should show. 3:06A trivial example — "make a dashboard on the number of emails I've received and sent, and show some behavior around that" — builds in about five minutes, with Claude pulling straight from Gmail. The caveat Scheffel flags immediately: at that point it's reading live from Gmail, not stashing anything in a database, so you can't report on the data over time or track changes. That's his whole argument for the middle layer.
The Supabase middle layer
4:43For anything real, Scheffel recommends a central database — in his case Supabase — as a data-lake/warehouse-style single source of truth, the pattern he says larger businesses already use. 5:29Supabase's free tier is 500 MB of storage; the cheapest paid tier is about $25/month. 6:00You want two Supabase pieces: the connector (which establishes the MCP connection the dashboard uses to query) and the plugin (which bundles skills Claude can use to follow best practices on schema structure, efficiency, and security). A useful detail: the Supabase CLI won't work for this, because the dashboard relies on the connector to query — so "avoid MCP out of the box" isn't an option here. An edge function acts as a listener that receives (for example) OpenTelemetry logs and writes them into the database, so the whole layer can be set up by Claude itself.
The "business rescue" skill
7:00Here the video turns self-promotional — Scheffel demos his own "business rescue" skill that automates the whole pipeline. It does five things: (1) a manifest that checks every MCP-connected system, their identities, domains, and blind spots you might not have thought about; (2) an evidence step that stores everything (including external data scraped via Apify, like Google reviews) in Supabase; (3) a forecast — a cash projection grounded in your actual Stripe/Xero data; (4) the rescue step that turns findings into actions a stakeholder can act on; and (5) a rescue report summarizing your biggest problems and where to steer next. It's a genuinely coherent workflow, but it's his product pitch, not part of the Claude launch — treat the five-step structure as reusable architecture and the "skill" itself as a sales artifact. He also promotes his AI-builders community at the end; links omitted here.
Scheduling freshness
9:50A beta reality-check worth keeping: the demo hit a real failure — "all queries ran successfully" when they clearly hadn't, with the dashboard empty until he said "the dashboard needs a fix" and Claude repaired it. 10:13The finished dashboard is interactive: tabs for coverage, compounding-over-time, problems, and accounting; and a chat/comment function where you can click any row and ask "tell me more about this" — Claude opens a side conversation and explains what the row is, why it's the biggest problem, and the fix. 10:31You can also flip out of comment mode to inspect the underlying SQL query, the data transform, and the result. 11:48The final piece is freshness: the dashboard only knows data as recent as what's been pulled into Supabase, so you ask Claude to schedule the sync — daily or weekly for most people — and it builds a scheduled task for you (or you create one manually under "scheduled tasks"). The same pattern extends to the observability dashboard: connect OpenTelemetry → Supabase, paste a prompt, and you get the live "command center" for your AI operating system.
Claims checked
Claude Dashboards is real. Anthropic launched Claude Dashboards (with Claude Motion) in beta on Oct 8, 2026 — builds a self-updating dashboard from connected data via plain-language questions. Docs/Slides/Design left beta onto every plan including Free. See the help-center guide and Anthropic's announcement.
Connectors + live interactive apps in Claude predate this (Aug 2026) — connectors can render interactive dashboards in-chat, so the "live vs static artifact" distinction is accurate.
Supabase details check out: free tier 500 MB, Pro ~$25/month, connector + plugin, edge functions as listeners.
The "business rescue" skill and the AI-builders community are Scheffel's own products, not part of the Claude launch. The five-step manifest/evidence/forecast/rescue/report workflow is retained as reusable architecture; his links are omitted.
Auto-caption garbles normalized: "superbase/superbased"→Supabase, "clawed infrastructure"→Claude infrastructure, "mark data"→mock data, "Zero"→Xero, "PC"→POC (proof of concept), "Manel"→Mansel.